plot_bubble_scatter_chart()
Plots a 3-variable bubble scatter plot where dot size encodes a third numeric dimension. Best for market sizing, portfolio analysis, and multi-dimensional comparisons.
Quick Example
import pandas as pd
import clean_charts as cc

df = pd.DataFrame({
    "State": ["CA", "TX", "FL", "NY", "IL", "PA", "OH", "GA", "NC", "MI"],
    "Cost of Living Index": [138, 92, 101, 134, 94, 98, 91, 89, 96, 90],
    "Median Income": [84, 67, 61, 75, 72, 67, 61, 65, 60, 63],
    "Population (M)": [39.0, 30.0, 22.2, 19.5, 12.5, 12.9, 11.7, 10.9, 10.6, 10.0]
})

cc.plot_bubble_scatter_chart(
    data=df,
    title="Economic Reality by State",
    subtitle="Cost of living vs Median Income. Bubble size = Population.",
    x_label="Cost of Living Index",
    y_label="Median Income",
    y_suffix="k",
    show_labels=True,
    alpha=0.6
)
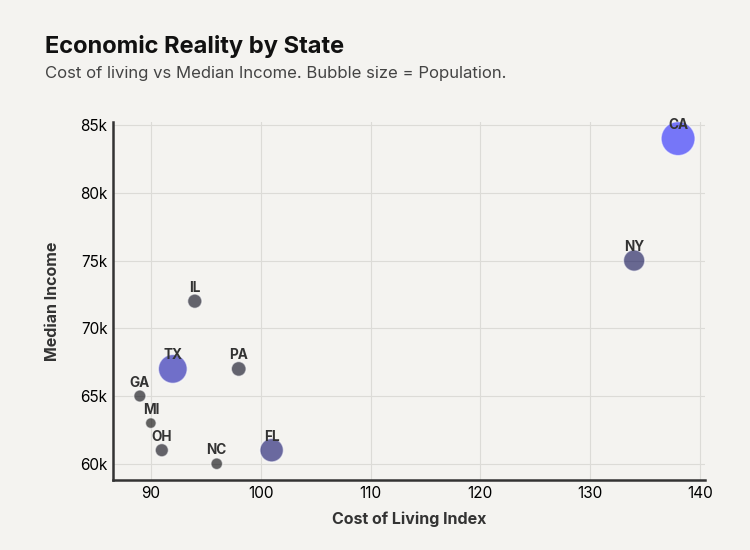
Example output for Bubble Scatter.
Data Requirements
- 3 columns — [X, Y, Size]
- 4 columns — [Label, X, Y, Size]
Parameters
| Parameter | Type | Default | Scope | Description |
|---|---|---|---|---|
data | pd.DataFrame | Built-in | Common | 3 or 4-column DataFrame. |
output_path | str | None | None | Common | File path to save. |
width | int | None | 700 | Common | Image width in pixels. |
height | int | None | 500 | Common | Image height in pixels. |
aspect_ratio | str | None | None | Common | "square", "landscape", etc. |
title | str | None | None | Common | Bold header text. |
subtitle | str | None | None | Common | Secondary text. |
bg_color | str | None | "#f4f3f0" | Common | Background hex color. |
scale_text | bool | True | Common | Scale fonts proportionally. |
min_bubble_size | float | 60 | Unique | Minimum bubble marker area in points². |
max_bubble_size | float | 600 | Unique | Maximum bubble marker area in points². |
start_color | str | None | None | Unique | Gradient start color for bubbles. |
end_color | str | None | None | Unique | Gradient end color for bubbles. |
color | str | None | None | Unique | Single color for all bubbles. |
alpha | float | 0.7 | Unique | Transparency (0.0–1.0). |
show_values | bool | False | Unique | Annotate bubbles with their size values. |
show_labels | bool | False | Unique | Annotate bubbles with label strings. |
x_label | str | None | None | Unique | X-axis label. |
y_label | str | None | None | Unique | Y-axis label. |