plot_grouped_scatter_chart()
Plots a grouped or quadrant-mapped scatter plot. Use group_by="category" for color-coded groups, or group_by="quadrant" for a 2×2 strategic matrix.
Quick Example
import pandas as pd
import numpy as np
import clean_charts as cc

np.random.seed(42)
n = 20

df = pd.concat([
    pd.DataFrame({
      "User": [f"P{i}" for i in range(n)],
      "Time (mins)": np.random.normal(120, 15, n),
      "Actions": np.random.normal(85, 10, n),
      "Segment": "Power Users"}),
    pd.DataFrame({
      "User": [f"C{i}" for i in range(n)],
      "Time (mins)": np.random.normal(30, 10, n),
      "Actions": np.random.normal(15, 5, n),
      "Segment": "Casual Browsers"}),
    pd.DataFrame({
      "User": [f"D{i}" for i in range(n)],
      "Time (mins)": np.random.normal(110, 20, n),
      "Actions": np.random.normal(20, 8, n),
      "Segment": "Passive Scrollers"})
])

cc.plot_grouped_scatter_chart(
    data=df,
    title="User Behavior Segments",
    subtitle="Identifying distinct cohorts by in-app activity",
    show_labels=False,
    alpha=1,
    axes_origin=(60,60)
)
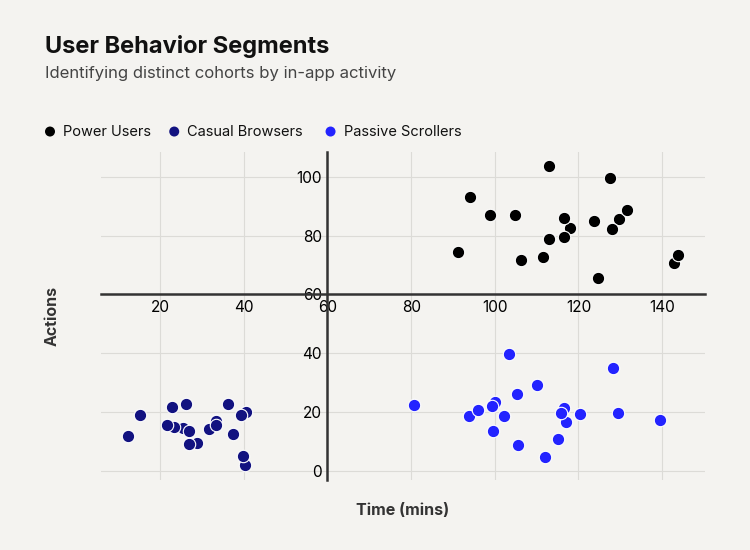
Example output for Grouped Scatter.
Data Requirements
- Categorical mode — 3–4 columns: [Label (opt), X, Y, Category]
- Quadrant mode — 2–3 columns: [Label (opt), X, Y]
Parameters
| Parameter | Type | Default | Scope | Description |
|---|---|---|---|---|
data | pd.DataFrame | Built-in | Common | DataFrame with X, Y, and optional label/category columns. |
output_path | str | None | None | Common | File path to save the chart. |
width | int | None | 700 | Common | Image width in pixels. |
height | int | None | 500 | Common | Image height in pixels. |
aspect_ratio | str | None | None | Common | "square", "landscape", etc. |
title | str | None | None | Common | Bold header text. |
subtitle | str | None | None | Common | Secondary text below title. |
bg_color | str | None | "#f4f3f0" | Common | Background hex color. |
scale_text | bool | True | Common | Scale fonts proportionally. |
group_by | str | None | None | Unique | "category" or "quadrant". |
x_threshold | float | None | Mean | Unique | Threshold line for quadrant X division. |
y_threshold | float | None | Mean | Unique | Threshold line for quadrant Y division. |
quadrant_labels | list[str] | None | Unique | Labels for [top-right, top-left, bottom-left, bottom-right]. |
show_threshold_lines | bool | True | Unique | Plot the x and y threshold lines. |
colors | list[str] | Auto | Unique | Explicit hex colors for categories/quadrants. |
start_color | str | None | None | Unique | Gradient start color for groups. |
end_color | str | None | None | Unique | Gradient end color for groups. |
dot_size | float | 80 | Unique | Marker size (area in points²). |
alpha | float | 0.75 | Unique | Transparency of points. |
x_label | str | None | None | Unique | X-axis label. |
y_label | str | None | None | Unique | Y-axis label. |
show_labels | bool | False | Unique | Annotate points with labels. |