plot_dashboard()
Combines multiple clean-chart visualizations into a single composite mosaic image. Each sub-chart is rendered independently and composited onto a shared canvas using an ASCII layout string.
Quick Example
import pandas as pd
import clean_charts as cc

df_ts = cc.get_default_data()
df_barh = pd.DataFrame({
    "Response": ["Strongly Agree", "Agree", "Neutral", "Disagree", "Strongly Disagree"],
    "Count": [42, 31, 18, 6, 3],
})
df_donut = pd.DataFrame({
    "Source": ["Organic", "Direct", "Social", "Referral", "Email", "Paid"],
    "Share": [38.2, 24.5, 15.8, 10.3, 7.1, 4.1],
})
df_dumbbell = pd.DataFrame({
    "Country": ["US", "China", "Germany", "UK", "India", "France"],
    "2010": [14.99, 6.09, 3.42, 2.48, 1.68, 2.65],
    "2023": [25.46, 17.79, 4.46, 3.33, 3.73, 3.05],
})

cc.plot_dashboard(
    charts=[
        (cc.plot_time_series,    {"data": df_ts,       "title": "Market Trends"}),
        (cc.plot_barh_chart,     {"data": df_barh,     "title": "Survey Results"}),
        (cc.plot_donut_chart,    {"data": df_donut,    "title": "Traffic Sources", "center_label": "100%"}),
        (cc.plot_dumbbell_chart, {"data": df_dumbbell, "title": "GDP Comparison", "value_suffix": "T"}),
    ],
    layout="AB\nCD",
    title="Executive Summary Dashboard",
    subtitle="Key metrics and trends at a glance",
    output_path="dashboard.png",
)
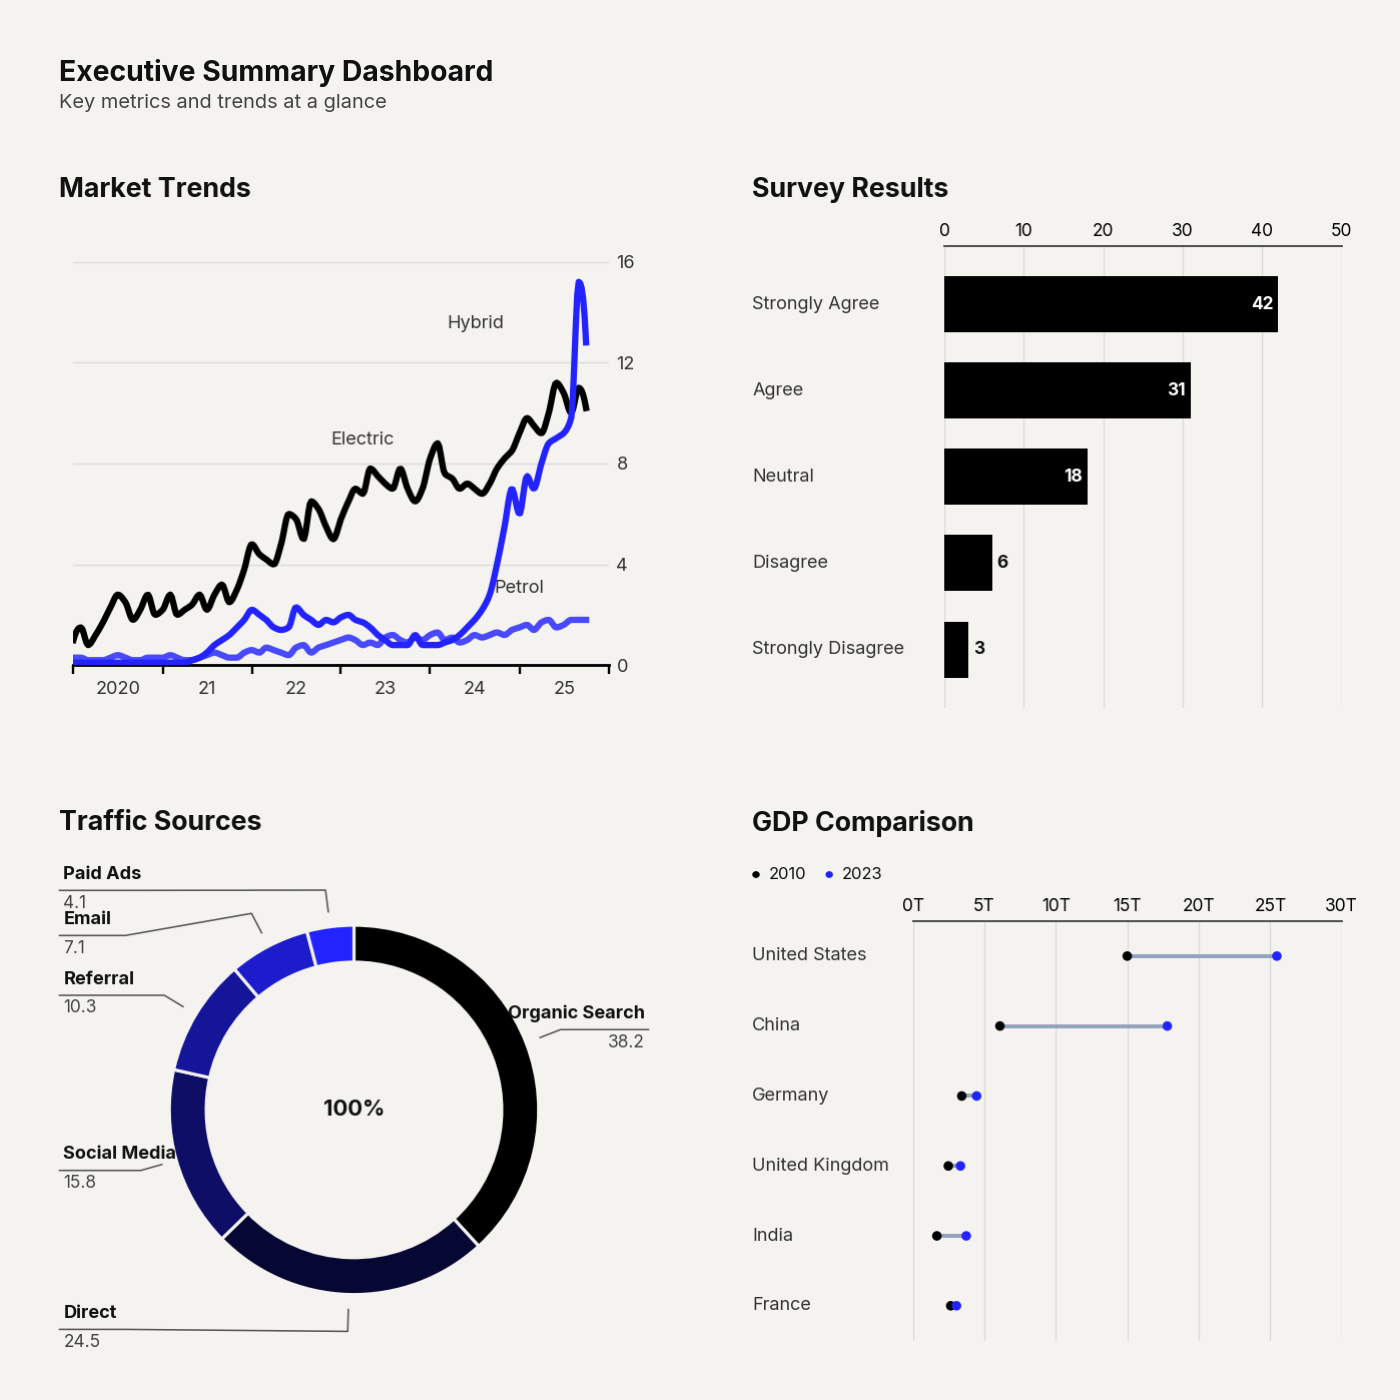
Example output for Dashboard.
Layout Syntax
The layout parameter uses an ASCII string:
- Each unique letter maps to one chart (in order of first appearance)
- Rows separated by
\n - A letter repeated horizontally spans multiple columns
- A letter repeated vertically spans multiple rows
- A period (
.) denotes an empty cell
| Layout String | Description |
|---|---|
"AB\nCD" |
2×2 grid, 4 equal charts |
"AA\nBC" |
A spans full top row; B and C split the bottom |
"ABC" |
Single row, 3 equal-width charts |
"AB\nAC" |
A spans left column; B and C stack on the right |
"AAB\nCCC" |
A takes 2/3 of top, B takes 1/3; C spans full bottom |
When layout=None, an auto-generated grid is created based on chart count.
Parameters
| Parameter | Type | Default | Scope | Description |
|---|---|---|---|---|
output_path | str | None | None | Common | File path to save. |
width | int | 1400 | Common | Final image width in pixels. |
height | int | None | Auto | Common | Final image height. Auto-derived from layout aspect ratio. |
title | str | None | None | Common | Dashboard-level title text. |
subtitle | str | None | None | Common | Dashboard-level subtitle. |
bg_color | str | None | "#f4f3f0" | Common | Canvas background color. |
charts | list[tuple] | Required | Unique | List of (plot_function, kwargs_dict) tuples. Each specifies a chart and its params. |
layout | str | None | Auto | Unique | ASCII mosaic string defining spatial arrangement. |
padding | float | 0.02 | Unique | Fractional space between sub-charts (0–0.5). |
Notes
- Any chart function can be used in a dashboard panel — including
plot_insight_card,plot_table, andplot_geofacet. - Do not include
output_pathin individual chart kwargs — it is managed internally. - For best quality, use
width=1400or higher for 4+ panel dashboards.